Using SmartPeak GUI
This page describes the graphical user interface (GUI) for working with SmartPeak. SmartPeak GUI provides functionality to facilitate users to get up and running as quickly as possible. SmartPeak GUI also provides various graphical views and plots to enable faster debugging and configuration of workflows and algorithms. After installation of SmartPeak on Windows, MacOS, and/or Linux, a shortcut should be available for quickly launching the application.
Path to logs
Default locations of logs:
Windows:
C:\Users\<user>\AppData\Local\SmartPeakLinux and MacOS:
~/.SmartPeak
User can change default location and specify directory where the logs are stored by setting SMARTPEAK_LOGS env variable.
If directory specified by the path doesn’t exist, SmartPeak will create it.
Load session and run workflow
Start the session with
File | New Session.Choose your working directory with
Change dir.When workflow successfully opens, run workflow with
Actions | Run workflow.
Integrity checks
The integrity of the loaded data can be checked with Actions | Integrity checks and select one option.
The results of the integrity checks can be viewed with View | Info.
Todo
Describe Integrity checks options..
Edit the workflow
You have an option to select the custom workflow or to choose the predefined set of operations.
Drag and drop steps of workflow to change their order, add or remove steps. Description of each step is available in the pop-up window.

View features
View and verify the workflow steps and input files with
View | Workflow.

The explorer panes can be used to filter the table views with
View | Injections or Transitions. Click on the checkbox under plot or table to include or exclude the injection or tansition from the view.
Changes to any of the input files can be made by reloading a modified .csv version of the file with
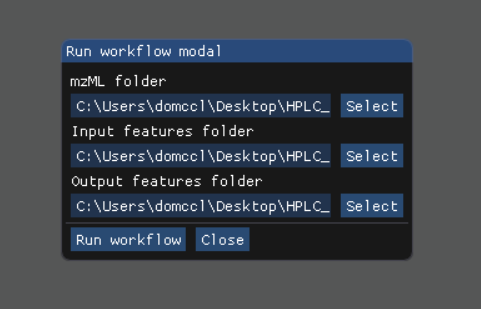
File | Import File.Run the workflow with
Actions | Run workflow. Verify or change the data input/output directories before running the workflow.
The status of the workflow can be monitored with
View | Info.

Alternatively, a more detailed status can be obtained with
View | Logwhich will display the most recent SmartPeak log information.

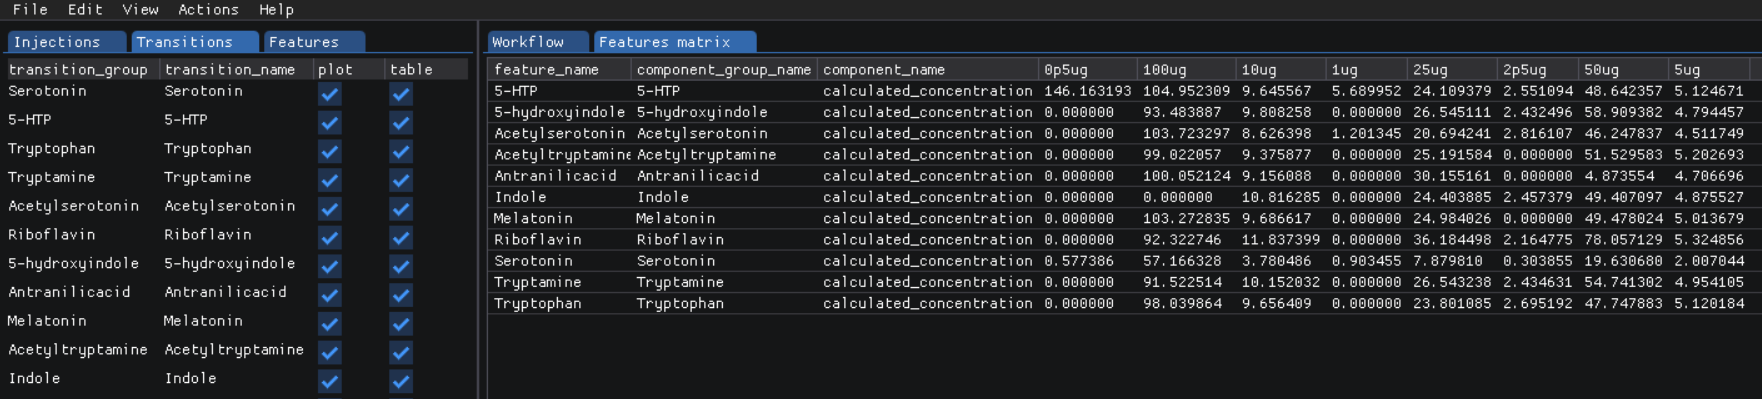
After the workflow has finished, the results can be viewed in a tabular form as a large data table with
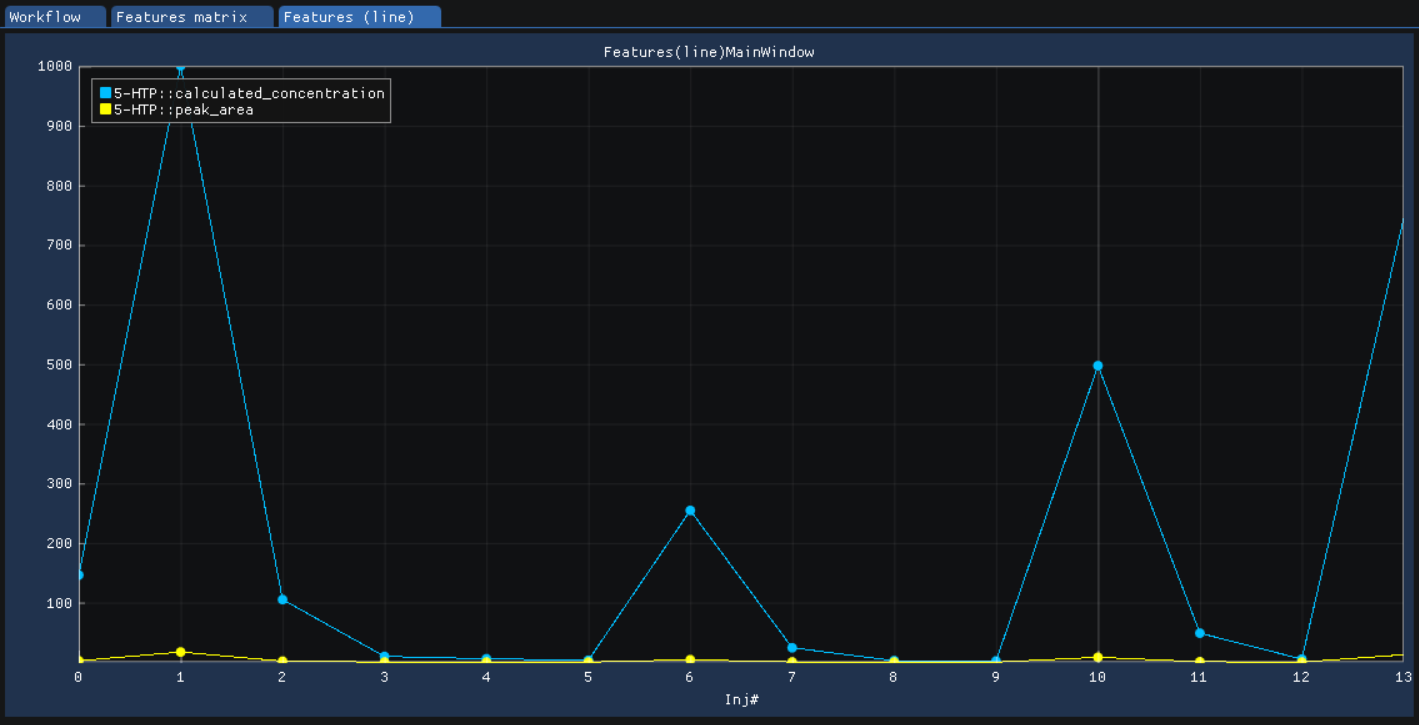
View | features (table). The feature metavalues shown can be added or removed withView | Featuresand clicking on the checkboxes under plot or table. For performance reasons, the amount of data that one can view is limited to 5000 entries.The results can be viewed in a graphical form as a line plot or as a heatmap with
View | features (line).
or View | features (heatmap)

The underlying data can also be displayed as a table matrix with
View | features (matrix). Samples, transitions, or feature metavalues can be included or excluded from any of the views using the explorer panes.
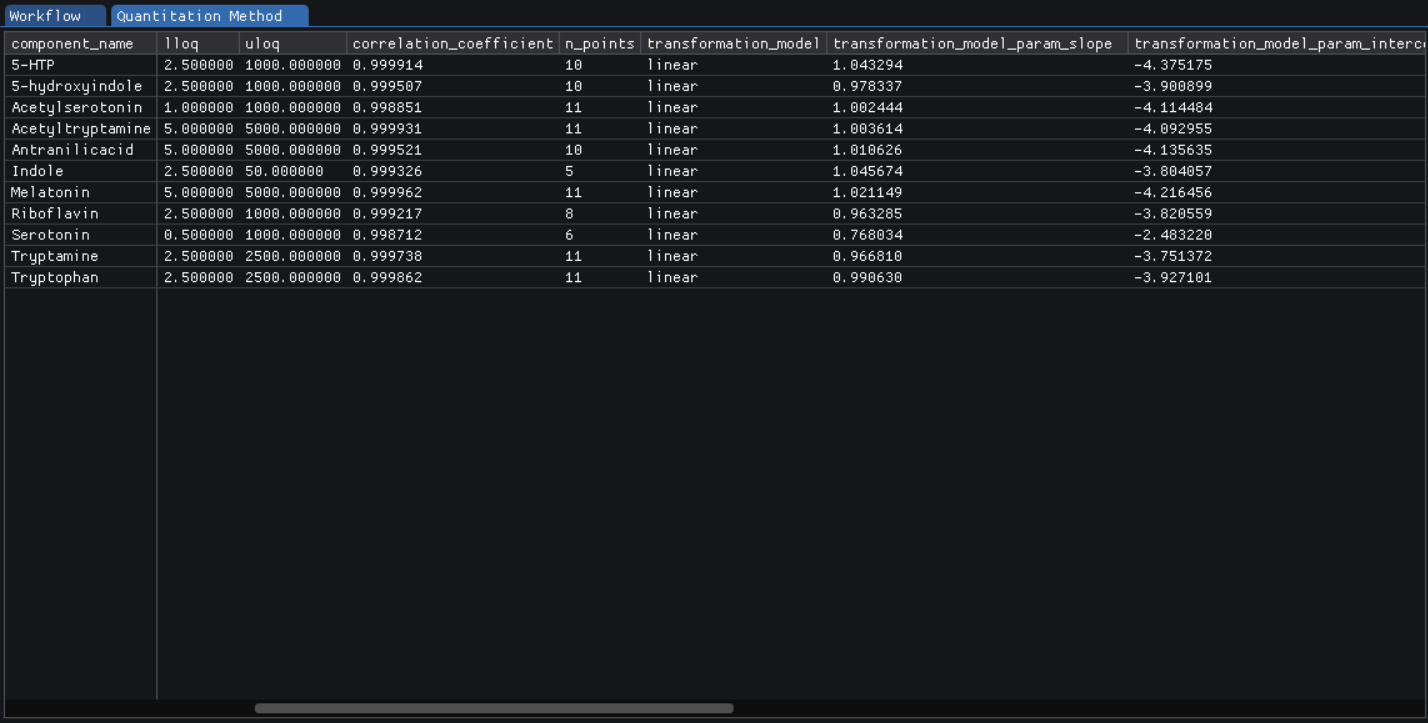
The results of calibration curve fitting can be inspected with
View | Workflow settings | Quant Methods.
A detailed look at the calibration fitted model and selected points for the model can be seen with
View | Calibrators.

For debugging problematic peaks, the raw chromatographic data and the picked and selected peaks can be viewed graphically with
View | Chromatograms. For performance reasons, the amount of data that one can view is limited to 9000 points.
Export report
You can export the report with Actions | Report. In the pop-up window select the information you want to include in the report, e.g. Sample types and Metadata.

The report is saved in the same location as the sequence.csv file.
Todo
Explain the difference in options: Create FeatureDB.csv and Create PivotTable.csv.