Non-targeted analysis using FIA-MS acquisition
This tutorial walks you through the workflow for analyzing non-targeted FIA-MS data starting from input file generation, to processing the data in SmartPeak, to reviewing the data in SmartPeak, to reporting the results.
Objectives
Obtaining the SOP for the workflow.
Choosing a data set for demonstrating the workflow.
Creating an optimized SmartPeak input templates for running the workflow.
The Workflows include
Defining the accurate mass search database
Processing Unknowns
Reviewing the results
Notes
The algorithm parameters used in the following workflows have been highly tuned for feature detection using the Thermo Orbitrap technology.
Slight modifications to the algorithm parameters in the FIAMS, Pick2DFeatures, and AccurateMassSearchEngine sections are needed for Time of Flight (ToF) technologies.
Steps
The tutorial includes the following steps :
Setting up the input files
The data set used can be found here FIAMS FullScan Unknowns.
The dataset includes a
CHEMISTRYfolder which contains HMDB (Human Metabolome Database) mapping files organized as follows:HMDB2StructMapping.tsv
This tab seperated file contains mapping of HMDB IDs, IUPAC Name, Compound Summary (Synonyms), Canonical SMILES and InChl.
HMDBMappingFile.tsv
This tab seperated file contains the Monoisotopic Molecular Weight and the Chemical Formula mapped to their respective HMDB ID.
negative_adducts.tsv
This file contains negative ion modes including the charge.
positive_adducts.tsv
This file contains positive ion modes including the charge.
The above files provided in the example are appropriate for applications involving human serum and other biosamples. For applications involving other organisms such as bacteria (e.g., E. coli), the use of organism specific databases are recommended to reduce the number of false positives. See FIA_MS_database_construction.ipynb for an example notebook demonstrating how to convert the metabolites in a genome-scale reconstruction to SmartPeak accurate mass mapping files.
Furthermore, the
parameters.csvfile contains the following settings for this workflow:FIAMS Settings in parameters.csv¶ function
name
type
value
default
restrictions
description
comparator
FIAMS
acquisition_start
float
0
0
0
The start time to use when extracting out the spectra windows from the MSExperiment
TRUE
FIAMS
acquisition_end
float
30
30
The end time to use when extracting out the spectra windows from the MSExperiment
TRUE
FIAMS
resolution
float
12000
120000
The instrument settings: resolution
TRUE
FIAMS
max_mz
float
1500
1500
Maximum mz
TRUE
FIAMS
bin_step
float
20
20
The size of the step to recalculated the bin size used for adding up spectra along the time axis
TRUE
Defining the workflow in SmartPeak
For FIAMS FullScan Unknowns analysis, the following steps are saved
into the workflow.csv file. Alternatively, steps can be replaced,
added or deleted direclty from SmartPeakGUI within the “workflow” tap in the right pane.
A detailed explanation of each command step
can be found in Workflow Commands.
workflow_FIAMS_Unknowns.csv¶ workflow_step
LOAD_RAW_DATA
EXTRACT_SPECTRA_WINDOWS
MERGE_SPECTRA
PICK_MS1_FEATURES
SEARCH_ACCURATE_MASS
STORE_ANNOTATIONS
STORE_FEATURES
ESTIMATE_FEATURE_BACKGROUND_INTERFERENCES
STORE_FEATURE_BACKGROUND_ESTIMATIONS
FILTER_FEATURES_BACKGROUND_INTERFERENCES
MERGE_FEATURES
MERGE_INJECTIONS
STORE_FEATURES_SAMPLE_GROUP
The workflow pipeline is initialized by loading the raw data followed by extracting the spectra windows based on the given parameters by the user then merging spectras over the time axis. Once done, the peak picking routine will be executed on the MS1 spectras followed by executing the mass search routine. As an intermediate workflow step, the mzTab annotations and feature lists are saved to disk as
mzTabandfeatureXMLfile formats respectively. The feature list can be saved before or after the features are annotated using the mass search routine depending upon whether a user would like to re-process the feature list using different accurate mass search databases. Options are included for retaining or removing features that were not annotated.A major processing step in this workflow is to estimate the Background Interferences for component features from blank samples. Blank samples in the
same sequence_segmentare used to estimate the average Background Intereference for each user specified component. The Background Intereference Estimates are saved to disk for inspection and re-use. Then, components can be filtered based on their percentage signal intensity found in the blanks and specified by the user.Another major processing step in the workflow is the merging of features and injections. Adducts corresponding to the same compound are merged into a single feature. Injections corresponding to a single sample are merged into a single sample. The user can specify which injections correspond to which sample group using the
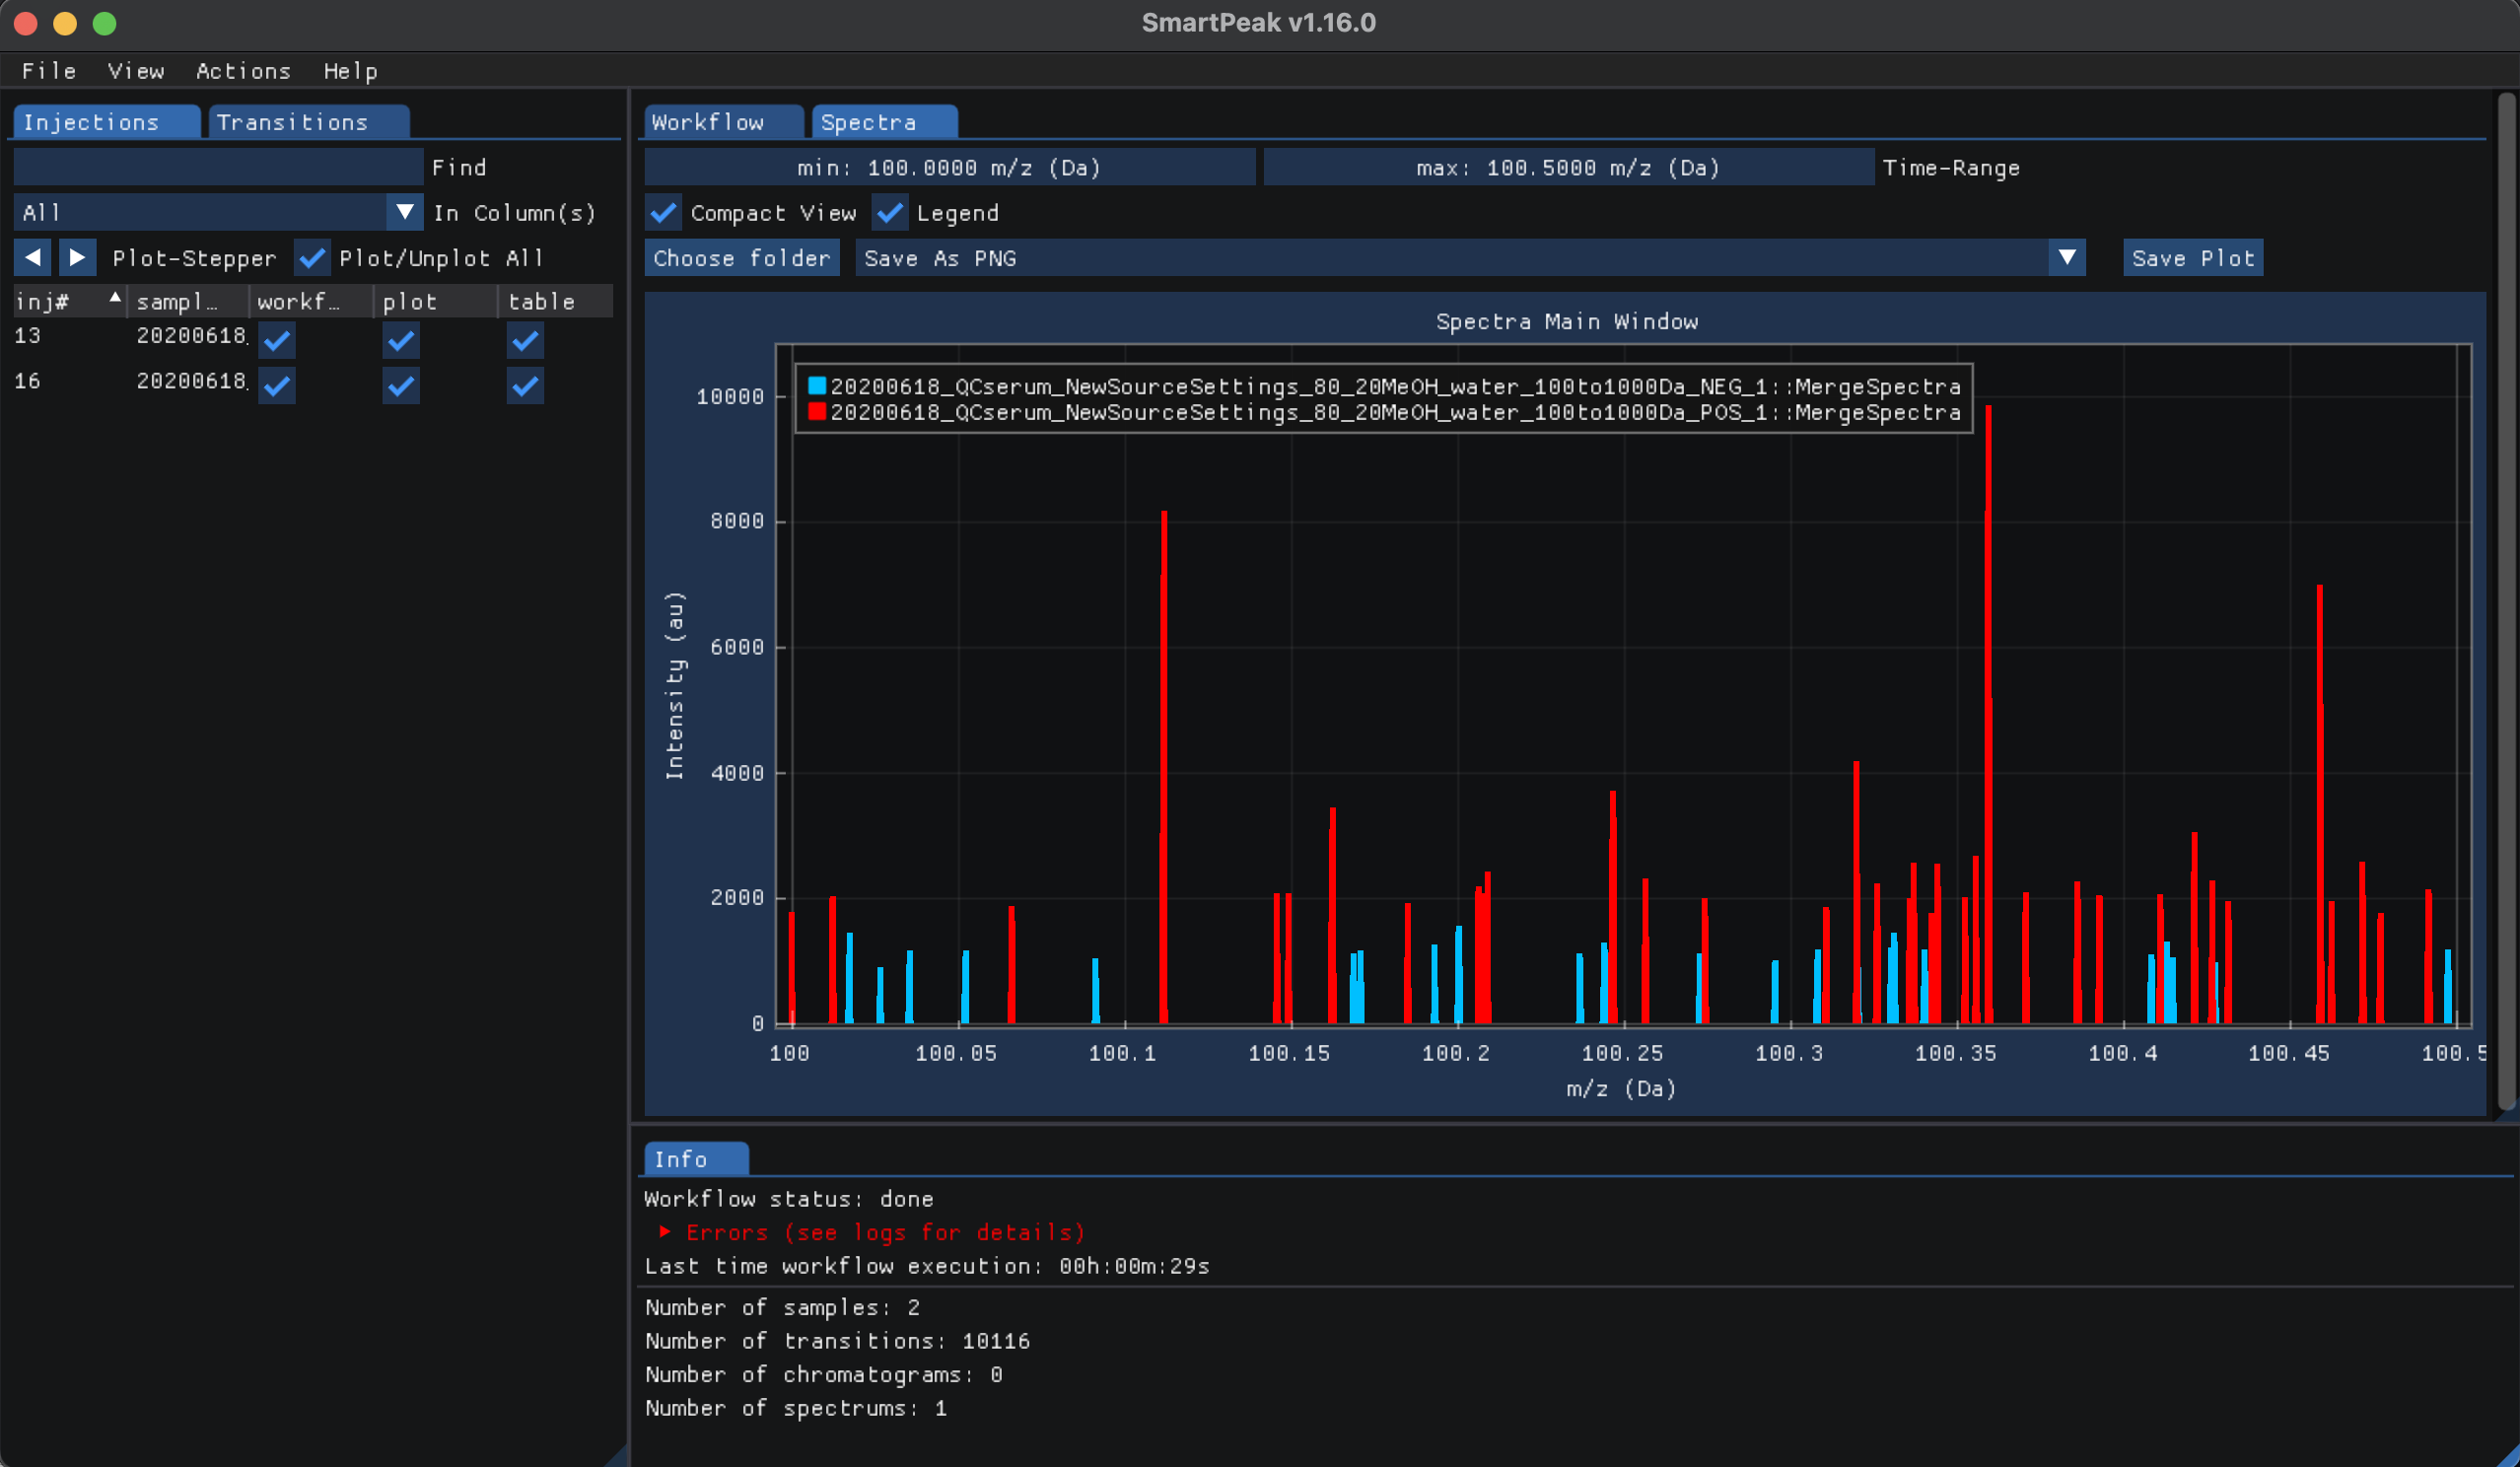
sample_group_namecolumn in thesequencefile. In addition, the user can specify how features and/or injections are merged in theparametersfile. Finally, features for the sample group (i.e., merged injections) are saved to disk as afeatureXMLfile.The Spectra for the two injection samples can be inspected after all workflow steps had been run, to do so please click on view and then “Spectra”. From the Injections tab check “Plot/Unplot All” select all injection samples and plot the mass to charge ratio relative to their respective intensities as shown below:
Reporting the results
To export the results, select “Report” from the “Actions” which will show the “Create Report” window:
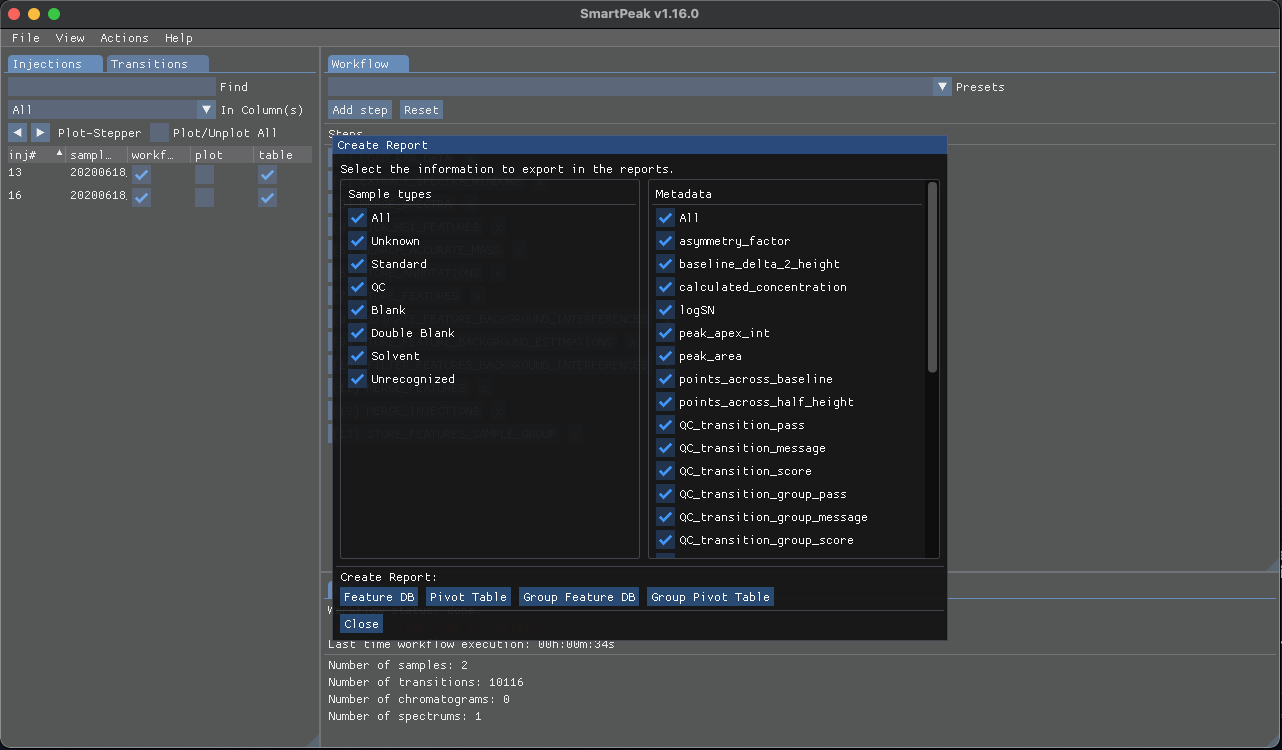
Based in the data you wish to export, select the desired “Sample types” from the left pane and select the “Metadata” from the right pane then click on of the buttons below to create the report with the selected items in the csv format.
Other options to export the data includes “Group Feature DB” and “Group Pivot Table”. The Group Feature DB includes all
sample_group_name,component_group_name,component_nameand any other additional metadata such aspeak_apex_int,peak_area, andmzvalues. While the Group Pivot Table would includecomponent_namecomponent_group_name,meta_valuesuch aspeak_apex_intandRT, andCMvalues.More details on exporting the results can be found in Export report.
The resulting
featureXMLandmzTabare saved in the features folder.featureXMLfiles describe the spectra data for a given injection sample which includes a list of features with a set ofUserParamfor each feature such asPeptideRef,native_idandscan_polarity. ThemzTabfile includes a summary of the accurate mass search. These files can be parsed and processed by the pyOpenMS Python package. Examples of FIA-MS post-processing analyses can be found in BFAIR.