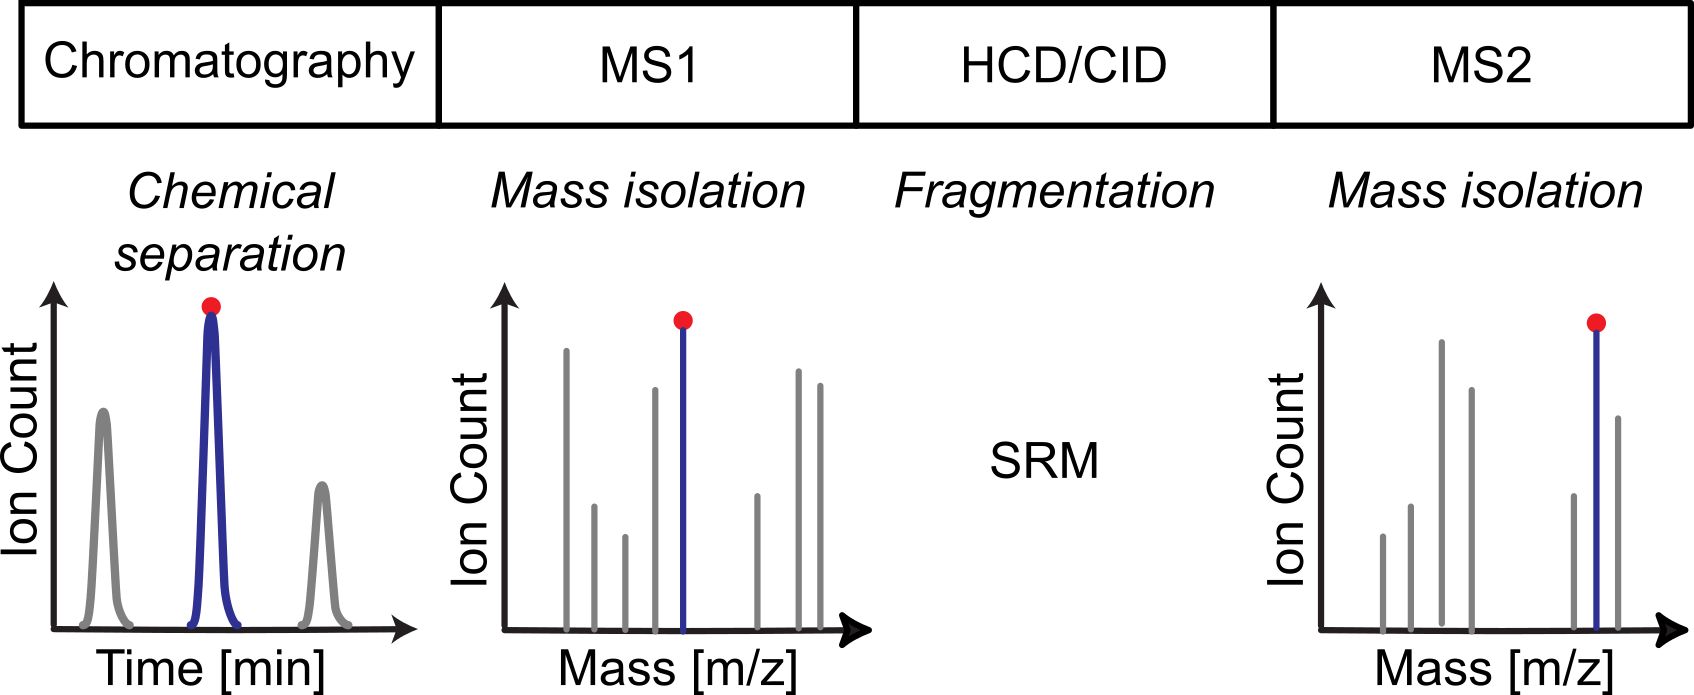
Targeted flux analysis using LC-MS/MS-SRM acquisition
This tutorial walks you through the workflow for analyzing targeted flux analysis using LC-MS/MS data starting from input file generation, to processing the data in SmartPeak, to reviewing the data in SmartPeak, to reporting the results.
Objectives
Obtaining the SOP for the workflow.
Choosing a data set for demonstrating the workflow.
Creating an optimized SmartPeak input templates for running the workflow.
The Workflows include
Processing Unknowns
Reviewing the results
Notes
The algorithm parameters used in the following workflows have been highly tuned for feature detection using tan Agilent HPLC and triple quad systems. With that said, we have found the algorithm parameters to generalize well to most liquid chromatography coupled to mass spectrometry systems.
Steps
The tutorial includes the following steps :
Setting up the input files
The data set used can be found here LCMS Targeted Flux Analysis.
The dataset includes a
parameters.csvfile containing parameter settings forMRMFeatureFinderScoring,MRMFeatureSelector,MRMFeatureValidator,ReferenceDataMethods,MRMFeatureSelector,MRMMapping,FeaturePlotter,SequenceSegmentPlotterandAbsoluteQuantitation.Defining the workflow in SmartPeak
For the targeted flux analysis via LC-MS/MS, the following steps are saved
into the workflow.csv file. Alternatively, steps can be replaced,
added or deleted direclty from SmartPeakGUI within the “workflow” tap in the right pane.
A detailed explanation of each command step
can be found in Workflow Commands.
workflow_LCMS_Flux_Unknowns.csv¶ workflow_step
LOAD_RAW_DATA
MAP_CHROMATOGRAMS
PICK_MRM_FEATURES
FILTER_FEATURES
CHECK_FEATURES
STORE_FEATURES
The workflow pipeline is initialized by loading the raw data followed by mapping the chromatograms to the loaded set og transitions. Once done, the peak picking routine will be executed on the SRM/MRM features followed by filtering the transitions and transition groups based on the user defined criteria. Before storing the features for the sample group to disk as a
featureXMLfile, transitions and transition groups are flagged and scored based on the user’s criteria.To plot the intensities over time for given injections and transitions, view the “chromatogram” from the “view” menu then select the injections and transitions to plot from their respective tabs on the left. The following shows the chromatogram for one injection using 6pgc and 23dpg transitions and their intensity differences over time.

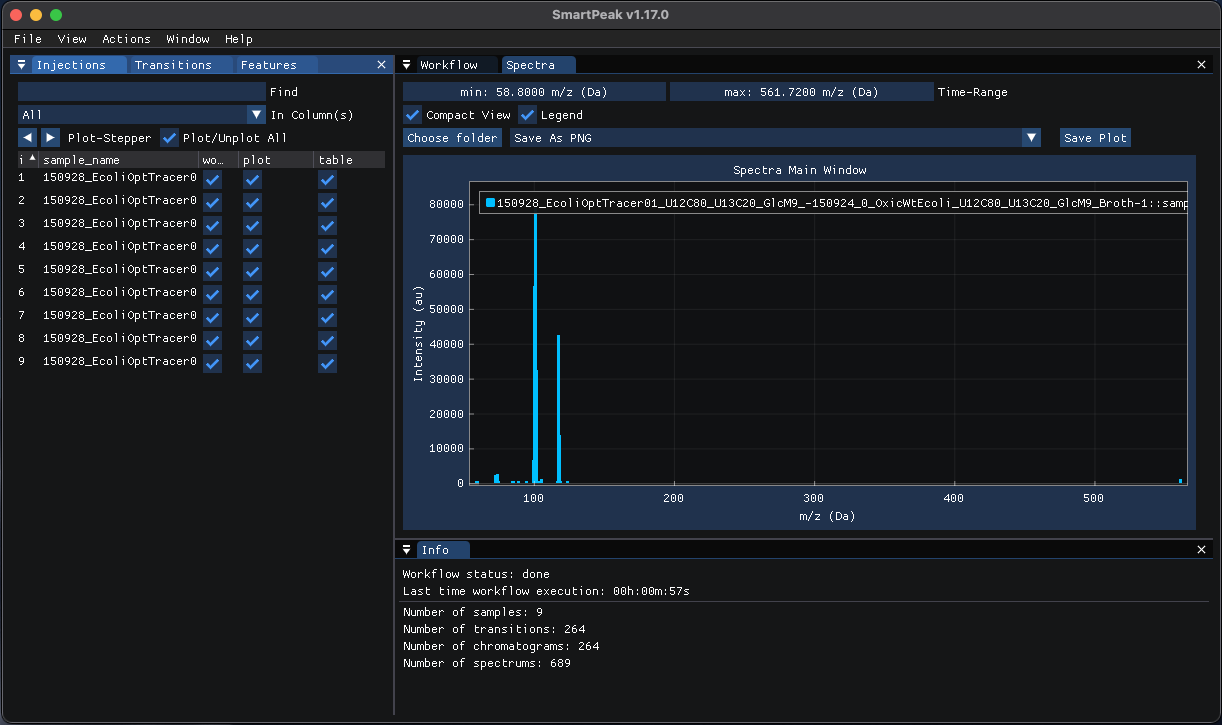
The Spectra for the two injection samples can be inspected after all workflow steps had been run, to do so please click on view and then “Spectra”. From the Injections tab check “Plot/Unplot All” select all injection samples and plot the mass to charge ratio relative to their respective intensities as shown below:
Reporting the results
To export the results, select “Report” from the “Actions” which will show the “Create Report” window:
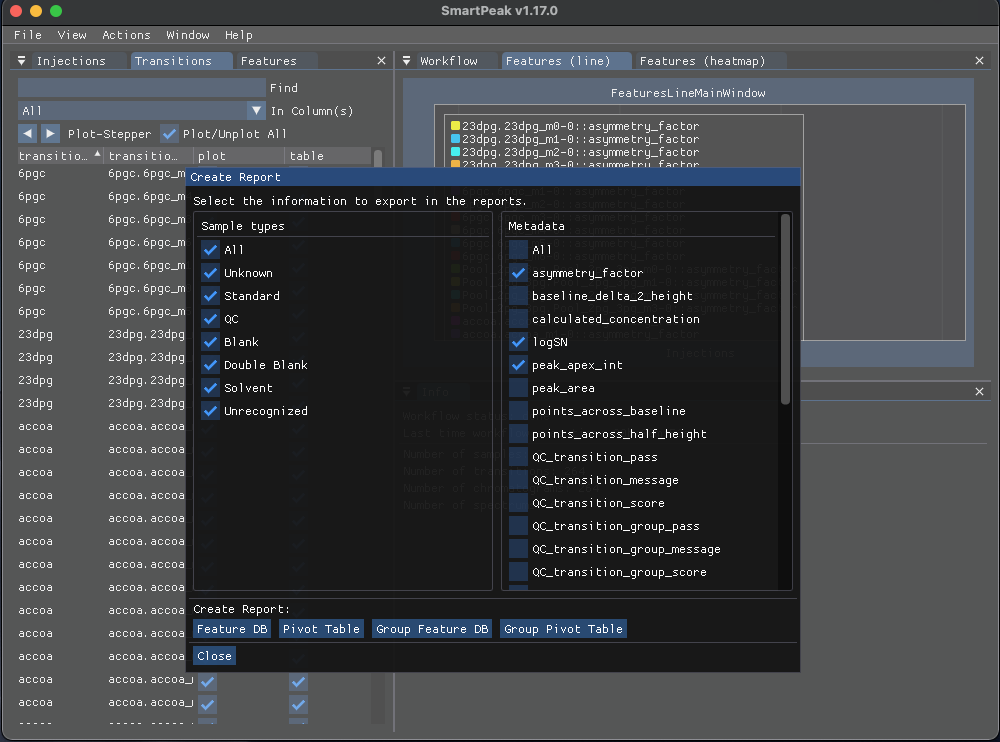
Based in the data you wish to export, select the desired “Sample types” from the left pane and select the “Metadata” from the right pane then click on one of the buttons below to create the report with the selected items in the csv format.
More details on exporting the results can be found in Export report.
The resulting
featureXMLandmzTabare saved in the features folder.featureXMLfiles describe the spectra data for a given injection sample which includes a list of features with a set ofUserParamfor each feature such asPeptideRef,native_idandscan_polarity.